A walk Through of oUr Platform
Explore the features available for both dotwatchers and organisers
The tracking maps built on our platform consists of two key sections: the public-facing map and the manager tool for race directors and event organisers. But despite this clear separation, many of the features on the public-facing map also prove invaluable to organisers.
Our platform is constantly evolving and each year we release new features, typically at the end of the winter when things have been al little quieter. Therefore, the overview below is far from exhaustive and there will inevitably be features we have not mentioned.
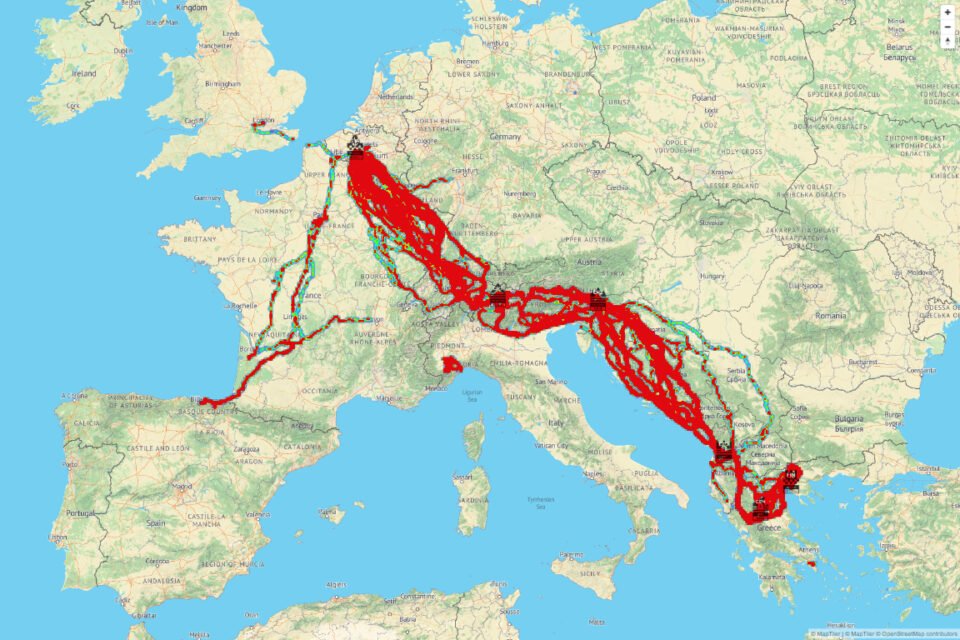
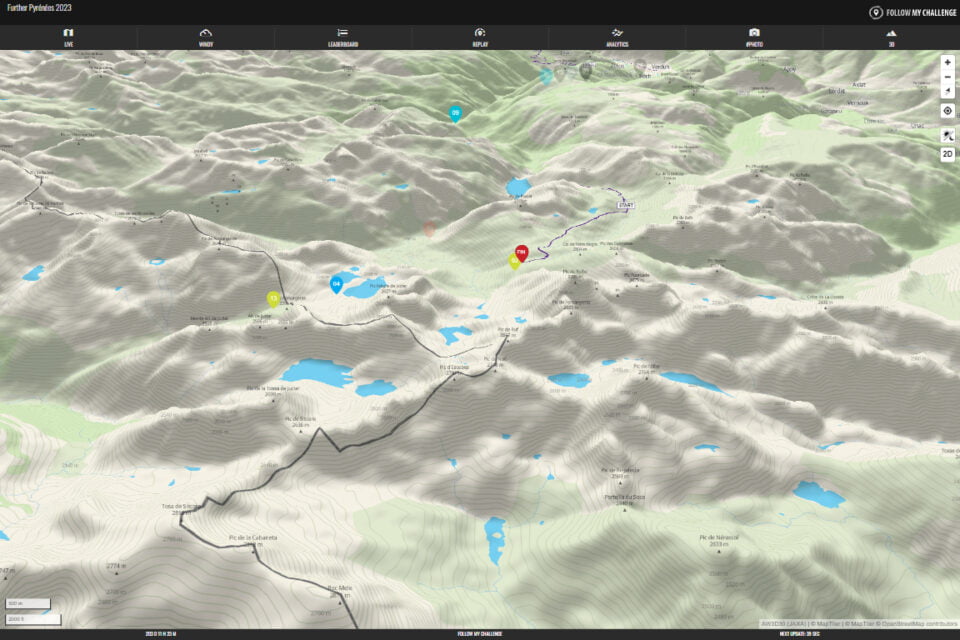
The Live Map
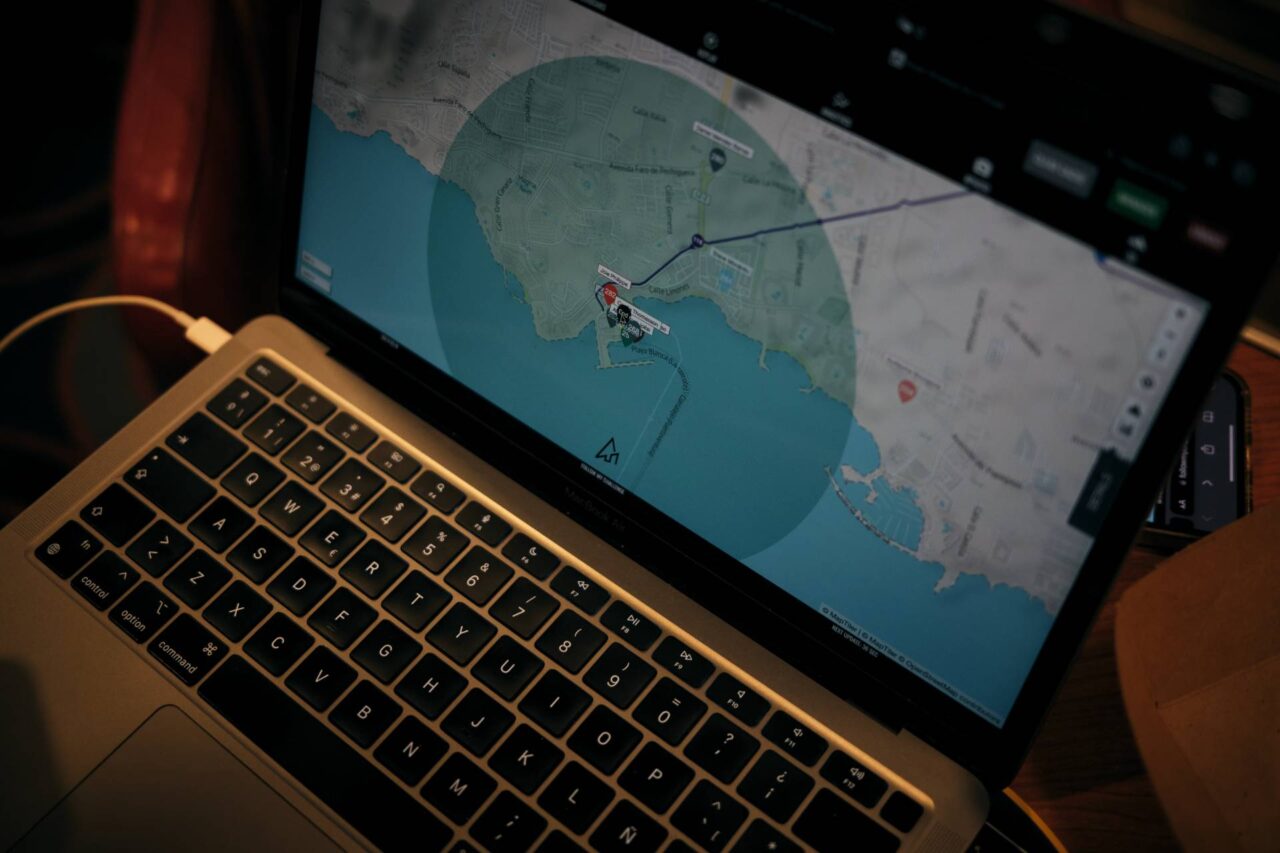
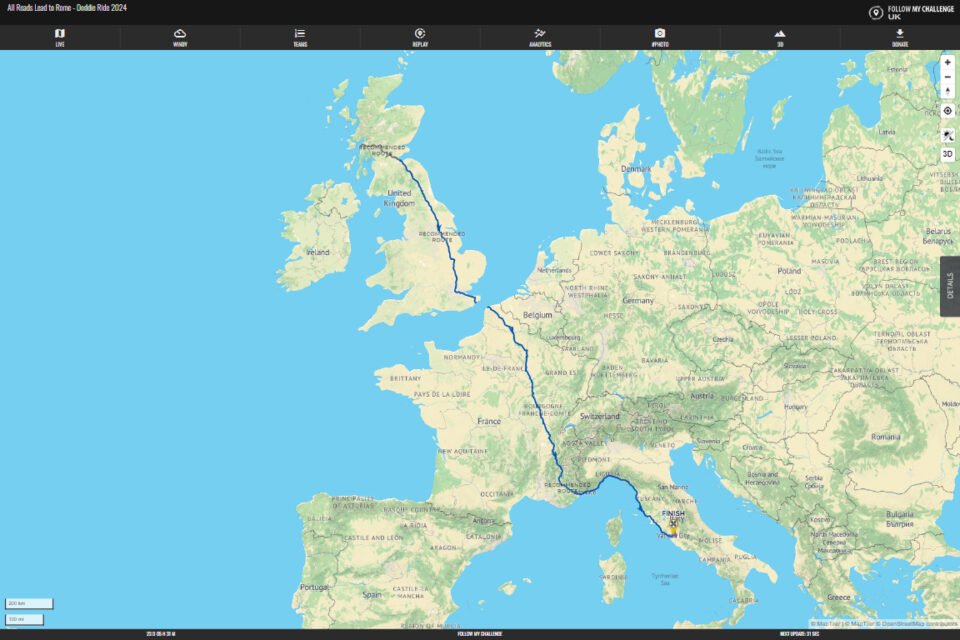
The default view for all our maps, this is where avid dotwatchers spend most of their time. Here, you can explore the route and click on participants to reveal more details about their speed, distance, moving time etc.
Our premium vector maps with contours and terrain shading help bring things to life. And for sponsors, this is where their logos are displayed.
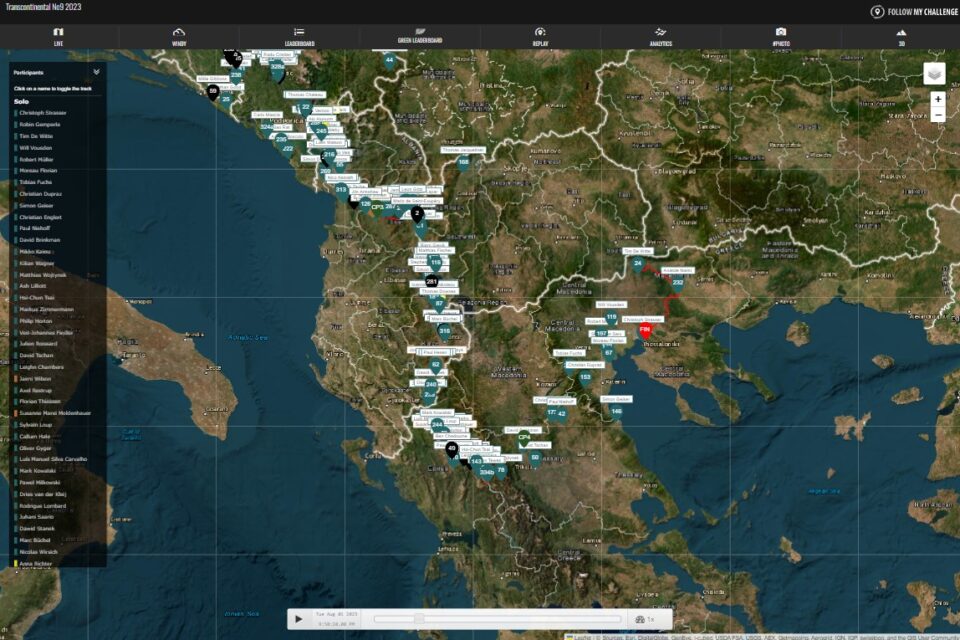
Details Tab
To quickly find a participant, the details tab on the right side of the screen is where to go. Here, you can search by name or number, as well as hide different groups and see the rankings at a glance.
Clicking on an individual’s name expands to reveal more info about their progress so far, as well as taking you to their current location and opening their historic track. This track is rich with data, allowing you to click into each tracking point.
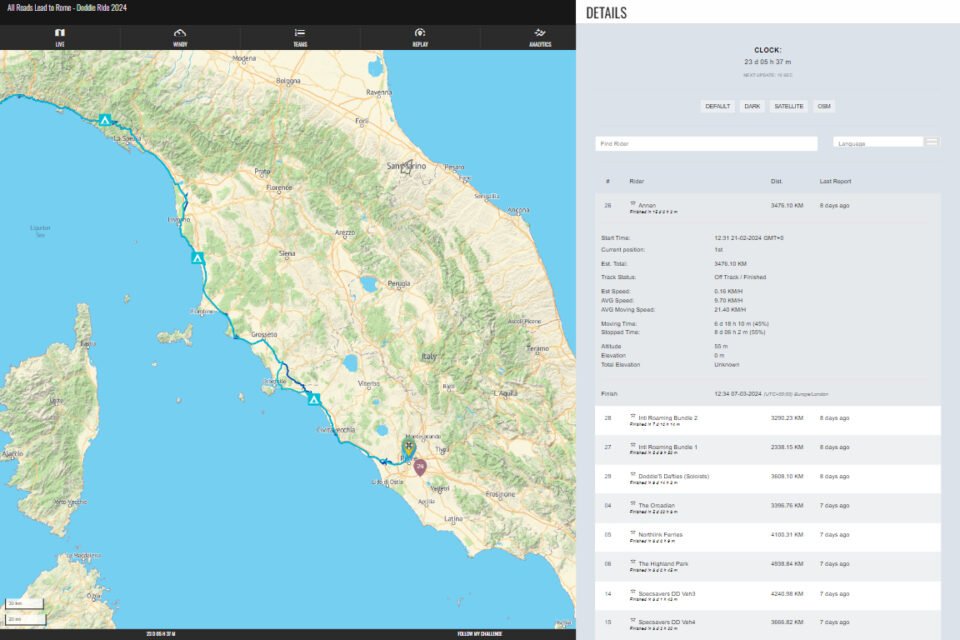
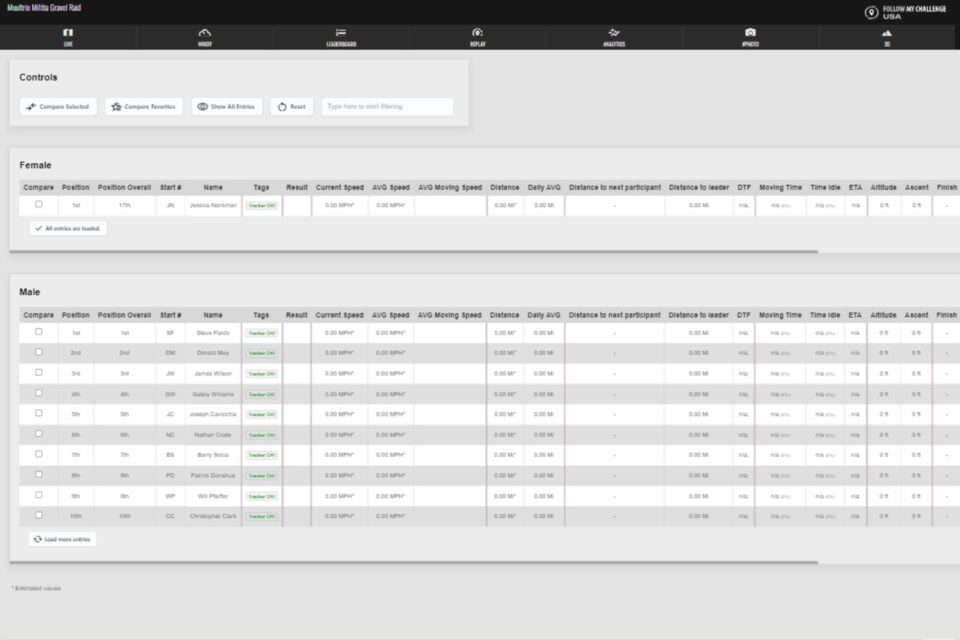
Leaderboard
This is the best place to see how a race is developing. Here, rankings are shown beside a variety of metrics, including speed, distance, daily average, distance to next participant etc.
Checkpoint times are also shown, alongside positional changes and segment times, allowing you to see how positions are changing throughout.
The leaderboard shows ranking by category and tags, but it also allows you to make your own selections for comparison, as well as filtering by name.
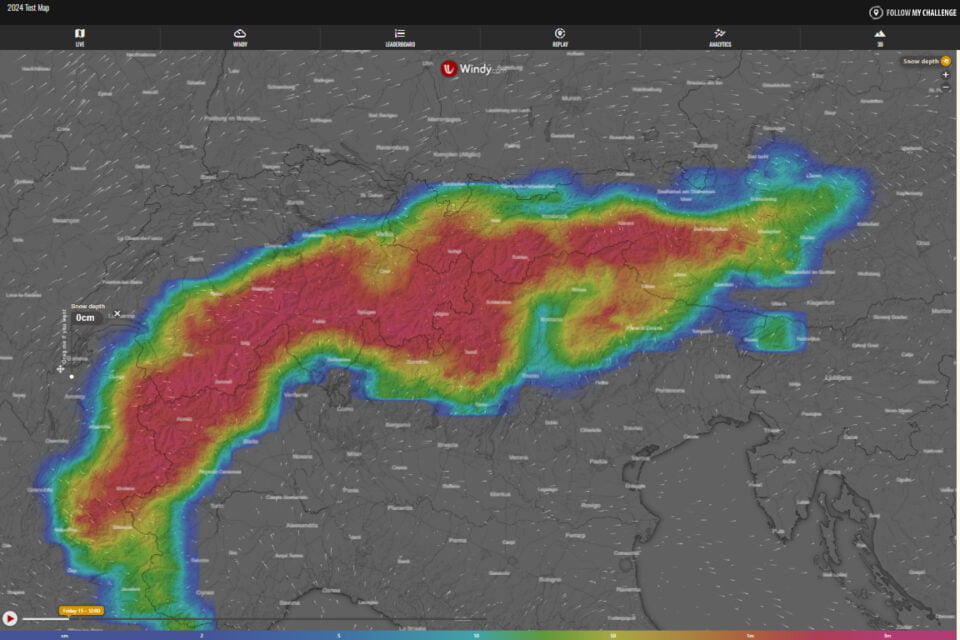
Windy Map
Wondering how conditions are impacting the event? There is no better place to visualise this than the Windy tab. With all premium layers included as standard on our maps, you have endless options to explore, ranging from fresh snowfall to pollen count.
Analytics
For a deep dive into race data, this is where to go. Our analytics section includes detailed race flow graphs and time-stopped charts. And for free-route races, there is also a heatmap layer that is overlaid on our vector mapping to see exactly which routes proved the most popular.
Replay
Missed the action? You can replay any event from the start using our replay tab. The controls allow you pause the replay, scroll through time and adjust the replay speed. You can also click on individual names to add their historic track to the map.
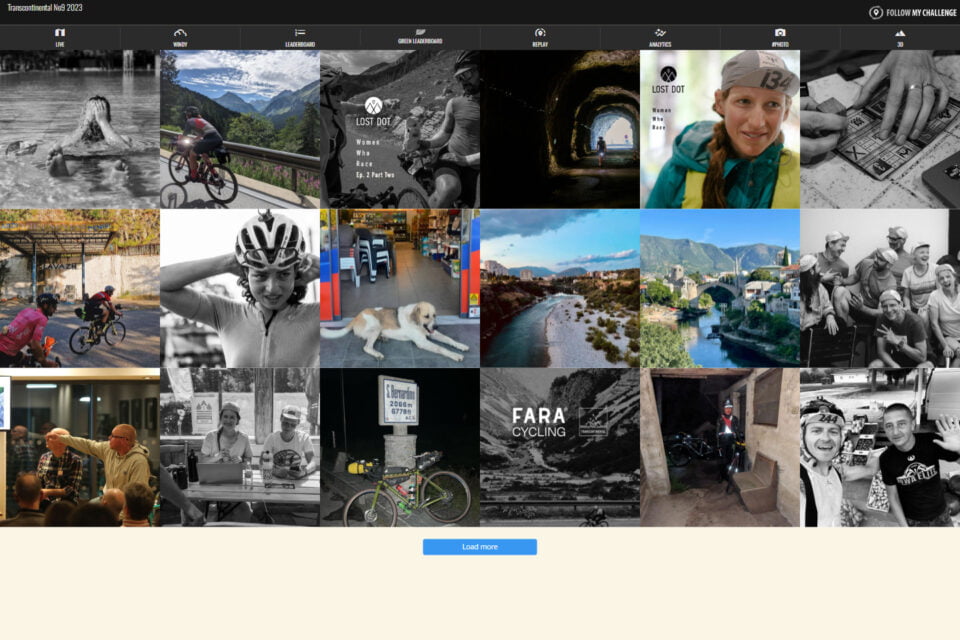
Instagram Feed
All our maps have the option to embed an Instagram feed, showcasing images from the event page or event hashtags. Accessible from within the map itself, this is a great way to help bring the dots to life.
3D Modes
In mountainous terrain, exploring the map in 3D brings an entirely different perspective. All our maps offer two different options with both satellite and vector mapping available in 3D.
Manager Mode
As an organiser, you get secure access to our manager mode, allowing you more control and insight. Below are a handful of the most popular features available
Participant Details
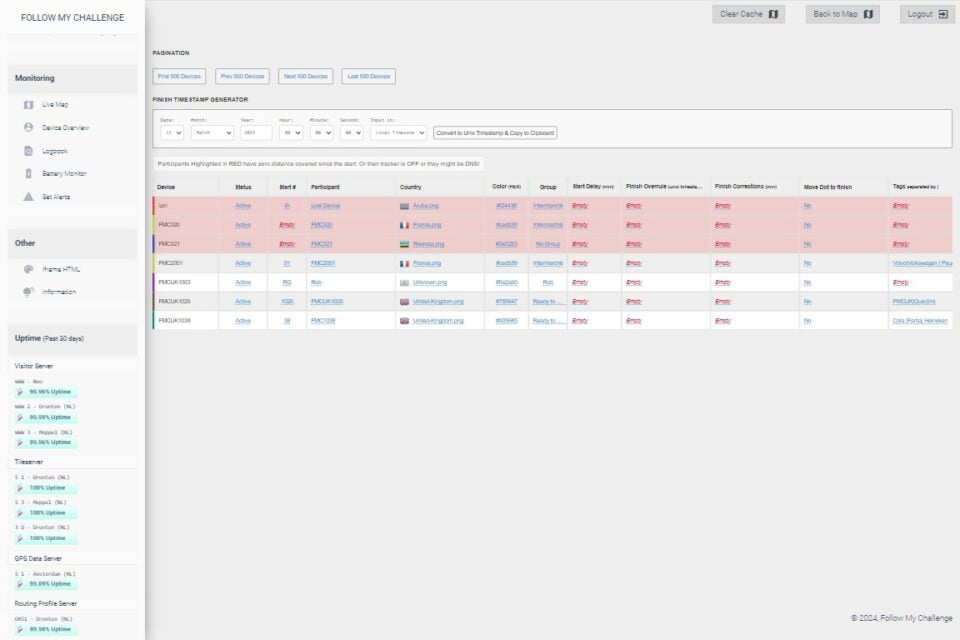
We load participant details for you, assigning them each to a tracker. But this tab allows you to make changes to names, nationalities or assigned groups. It is also where you can mark individuals as DNS/DSQ/DNF during the event.
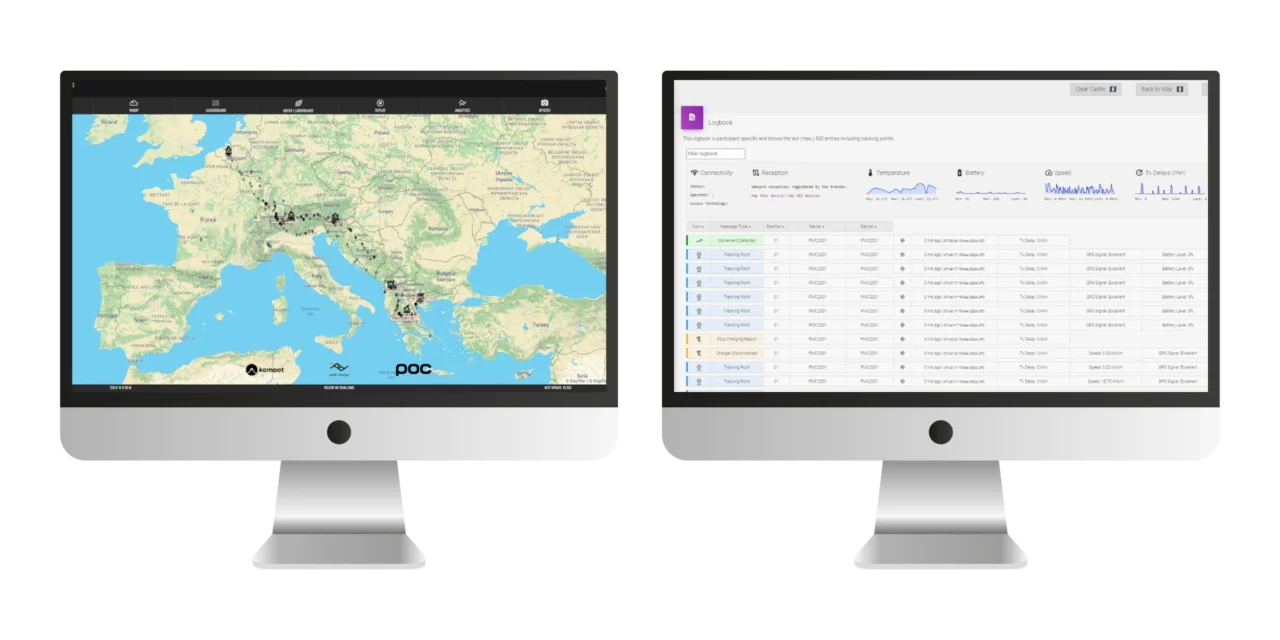
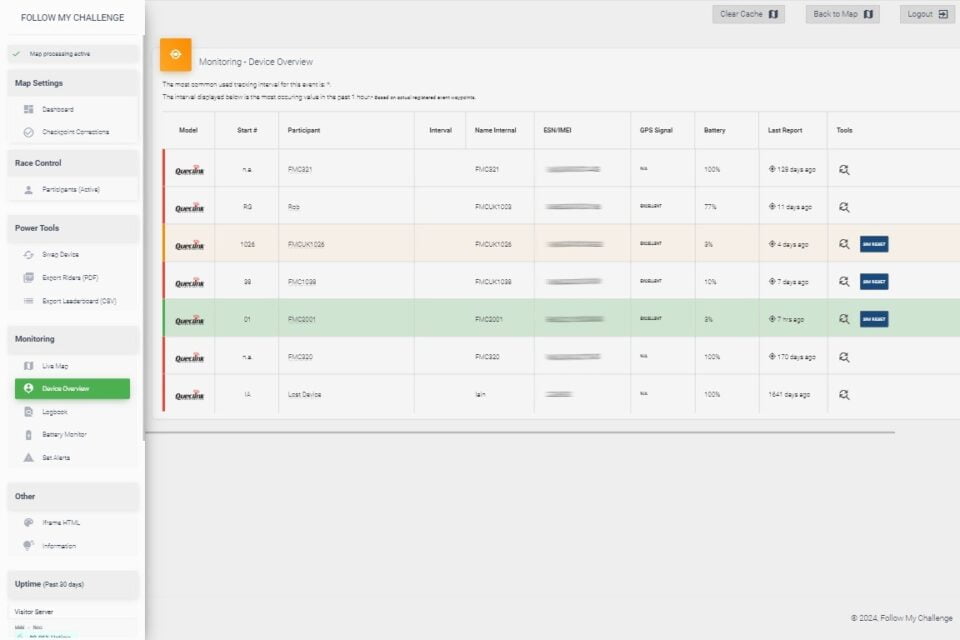
Device Overview
Before the event starts, this tab gives you a quick overview of the status of all devices. As trackers are turned on, they will turn green and you will be able to see when they last pinged. Here, you can also verify battery levels and push a network reset command if there are connectivity issues.

Detailed Monitoring
Our manager contains incredibly detailed logs, accessible for every connected device. These record events transmitted, including power on/off, charging start/stop and tracking points.
The primary function of these logs is to enable remote diagnostics and make swift recommendations when issues are encountered. However, they are also powerful tools to combat any attempts to subvert event rules and allow for a forensic examination of the data.
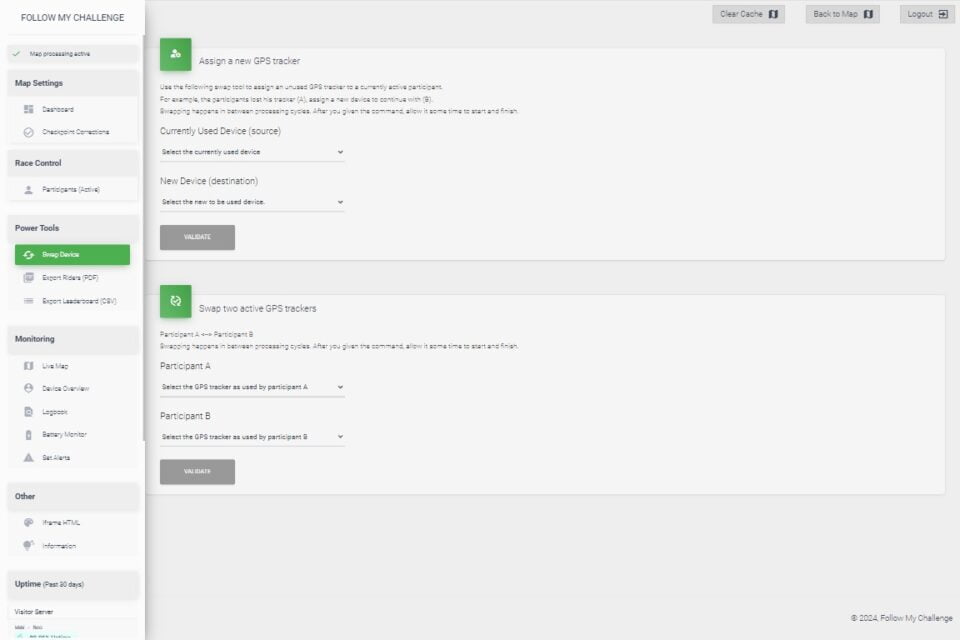
Tracker Swaps
If devices misbehave or participants accidentally take the wrong tracker, our manager allows you to swap trackers easily. Two versions of this swap tool exist, with one designed specifically for swapping in a new device, allowing all historic tracking data to be preserved on the map and minimising any disruption.

SMS/Email Alerts
All our maps have the ability to send SMS and email alerts to a set list of contacts that can be triggered by proximity to the finish. This is incredibly useful if you have a participant finishing late at night and want alerting when they are 20 kilometres away. We include the first 20 SMS credits free of charge.